想做一个简单的数据库表的统计工具。
用 AI,感觉整个人脑子都不好用了。
import pyodbcimport pandas as pdimport matplotlib.pyplot as pltimport seaborn as snsfrom datetime import datetimeimport warningswarnings.filterwarnings('ignore')class MSSQLTableAnalyzer: def __init__(self, server, database, username=None, password=None, trusted_connection=True): """ Initialize MSSQL connection Args: server: SQL Server name or IP database: Database name username: Username (optional if using Windows Authentication) password: Password (optional if using Windows Authentication) trusted_connection: Use Windows Authentication (default: True) """ self.server = server self.database = database self.username = username self.password = password self.trusted_connection = trusted_connection self.connection = None def connect(self): """Establish connection to MSSQL database""" try: if self.trusted_connection: # Windows Authentication connection_string = f""" DRIVER={{ODBC Driver 17 for SQL Server}}; SERVER={self.server}; DATABASE={self.database}; Trusted_Connection=yes; """ else: # SQL Server Authentication connection_string = f""" DRIVER={{ODBC Driver 17 for SQL Server}}; SERVER={self.server}; DATABASE={self.database}; UID={self.username}; PWD={self.password}; """ self.connection = pyodbc.connect(connection_string) print(f"✅ Successfully connected to {self.database} on {self.server}") return True except Exception as e: print(f"❌ Connection failed: {str(e)}") return False def get_table_counts(self): """Query all tables and their row counts""" if not self.connection: print("❌ No database connection established") return None try: # Query to get all user tables and their row counts query = """ SELECT t.TABLE_SCHEMA as [Schema], t.TABLE_NAME as [Table_Name], p.rows as [Row_Count] FROM INFORMATION_SCHEMA.TABLES t INNER JOIN sys.tables st ON st.name = t.TABLE_NAME INNER JOIN sys.partitions p ON st.object_id = p.object_id WHERE t.TABLE_TYPE = 'BASE TABLE' AND p.index_id < 2 ORDER BY p.rows DESC, t.TABLE_SCHEMA, t.TABLE_NAME """ df = pd.read_sql_query(query, self.connection) print(f" Found {len(df)} tables in database") return df except Exception as e: print(f"❌ Query failed: {str(e)}") return None def create_bar_chart(self, df, max_tables=20, chart_type='horizontal'): """ Create bar chart for table row counts Args: df: DataFrame with table information max_tables: Maximum number of tables to display chart_type: 'horizontal' or 'vertical' """ if df is None or df.empty: print("❌ No data to display") return # Prepare data for visualization df_display = df.head(max_tables).copy() df_display['Full_Name'] = df_display['Schema'] + '.' + df_display['Table_Name'] # Set up the plot style plt.style.use('seaborn-v0_8') fig, ax = plt.subplots(figsize=(12, 8)) # Create color palette colors = plt.cm.viridis(range(len(df_display))) if chart_type == 'horizontal': bars = ax.barh(df_display['Full_Name'], df_display['Row_Count'], color=colors) ax.set_xlabel('Number of Rows', fontsize=12, fontweight='bold') ax.set_ylabel('Table Name', fontsize=12, fontweight='bold') # Add value labels on bars for i, bar in enumerate(bars): width = bar.get_width() ax.text(width + max(df_display['Row_Count']) * 0.01, bar.get_y() + bar.get_height()/2, f'{int(width):,}', ha='left', va='center', fontsize=10) else: bars = ax.bar(range(len(df_display)), df_display['Row_Count'], color=colors) ax.set_xlabel('Table Name', fontsize=12, fontweight='bold') ax.set_ylabel('Number of Rows', fontsize=12, fontweight='bold') ax.set_xticks(range(len(df_display))) ax.set_xticklabels(df_display['Full_Name'], rotation=45, ha='right') # Add value labels on bars for i, bar in enumerate(bars): height = bar.get_height() ax.text(bar.get_x() + bar.get_width()/2, height + max(df_display['Row_Count']) * 0.01, f'{int(height):,}', ha='center', va='bottom', fontsize=10) # Customize the chart ax.set_title(f'Database Table Row Counts - {self.database}\n' f'Top {min(max_tables, len(df))} Tables by Row Count', fontsize=14, fontweight='bold', pad=20) # Format y-axis to show numbers with commas ax.yaxis.set_major_formatter(plt.FuncFormatter(lambda x, p: f'{int(x):,}')) if chart_type == 'vertical': ax.yaxis.set_major_formatter(plt.FuncFormatter(lambda x, p: f'{int(x):,}')) else: ax.xaxis.set_major_formatter(plt.FuncFormatter(lambda x, p: f'{int(x):,}')) # Add grid for better readability ax.grid(True, alpha=0.3, axis='x' if chart_type == 'horizontal' else 'y') # Add timestamp timestamp = datetime.now().strftime("%Y-%m-%d %H:%M:%S") plt.figtext(0.99, 0.01, f'Generated: {timestamp}', ha='right', va='bottom', fontsize=8, alpha=0.7) plt.tight_layout() plt.show() # Print summary statistics total_rows = df['Row_Count'].sum() avg_rows = df['Row_Count'].mean() print(f"\n Summary Statistics:") print(f" Total Tables: {len(df):,}") print(f" Total Rows: {total_rows:,}") print(f" Average Rows per Table: {avg_rows:,.0f}") print(f" Largest Table: {df.iloc[0]['Schema']}.{df.iloc[0]['Table_Name']} ({df.iloc[0]['Row_Count']:,} rows)") def get_schema_summary(self, df): """Create summary by schema""" if df is None or df.empty: return None schema_summary = df.groupby('Schema').agg({ 'Table_Name': 'count', 'Row_Count': ['sum', 'mean', 'max'] }).round(0) schema_summary.columns = ['Table_Count', 'Total_Rows', 'Avg_Rows', 'Max_Rows'] schema_summary = schema_summary.sort_values('Total_Rows', ascending=False) return schema_summary def create_schema_chart(self, df): """Create bar chart grouped by schema""" schema_summary = self.get_schema_summary(df) if schema_summary is None: return fig, (ax1, ax2) = plt.subplots(1, 2, figsize=(15, 6)) # Chart 1: Total rows by schema colors1 = plt.cm.Set3(range(len(schema_summary))) bars1 = ax1.bar(schema_summary.index, schema_summary['Total_Rows'], color=colors1) ax1.set_title('Total Rows by Schema', fontsize=12, fontweight='bold') ax1.set_xlabel('Schema', fontsize=10) ax1.set_ylabel('Total Rows', fontsize=10) ax1.tick_params(axis='x', rotation=45) # Add value labels for bar in bars1: height = bar.get_height() ax1.text(bar.get_x() + bar.get_width()/2, height, f'{int(height):,}', ha='center', va='bottom', fontsize=9) # Chart 2: Table count by schema colors2 = plt.cm.Set2(range(len(schema_summary))) bars2 = ax2.bar(schema_summary.index, schema_summary['Table_Count'], color=colors2) ax2.set_title('Table Count by Schema', fontsize=12, fontweight='bold') ax2.set_xlabel('Schema', fontsize=10) ax2.set_ylabel('Number of Tables', fontsize=10) ax2.tick_params(axis='x', rotation=45) # Add value labels for bar in bars2: height = bar.get_height() ax2.text(bar.get_x() + bar.get_width()/2, height, f'{int(height)}', ha='center', va='bottom', fontsize=9) plt.tight_layout() plt.show() print("\n Schema Summary:") print(schema_summary.to_string()) def close_connection(self): """Close database connection""" if self.connection: self.connection.close() print(" Database connection closed")def main(): """Main execution function""" # Database connection parameters # Modify these parameters according to your environment SERVER = "localhost" # or your server name/IP DATABASE = "YourDatabaseName" # replace with your database name # Initialize analyzer analyzer = MSSQLTableAnalyzer( server=SERVER, database=DATABASE, trusted_connection=True # Set to False if using SQL Server Authentication ) # Connect to database if not analyzer.connect(): return try: # Get table counts print(" Querying table information...") df = analyzer.get_table_counts() if df is not None and not df.empty: # Create main bar chart print(" Creating bar chart...") analyzer.create_bar_chart(df, max_tables=15, chart_type='horizontal') # Create schema summary chart print(" Creating schema summary...") analyzer.create_schema_chart(df) # Export to CSV (optional) csv_filename = f"table_counts_{analyzer.database}_{datetime.now().strftime('%Y%m%d_%H%M%S')}.csv" df.to_csv(csv_filename, index=False) print(f" Data exported to: {csv_filename}") else: print("❌ No table data retrieved") except Exception as e: print(f"❌ Error during execution: {str(e)}") finally: # Always close the connection analyzer.close_connection()if __name__ == "__main__": # Example usage print(" MSSQL Table Count Analyzer") print("=" * 40) # You can also use the analyzer directly: # analyzer = MSSQLTableAnalyzer("your_server", "your_database") # if analyzer.connect(): # df = analyzer.get_table_counts() # analyzer.create_bar_chart(df) # analyzer.close_connection() main()
虽然离要求还是有点距离,但要用的几个库和数据库连接都没啥问题。
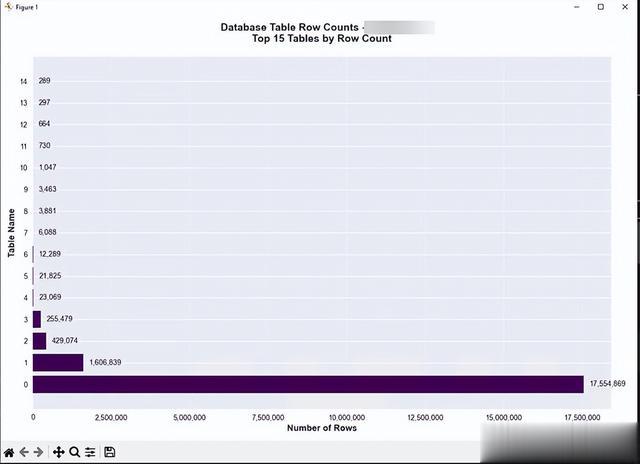
生成的图表也还能看。